The design question
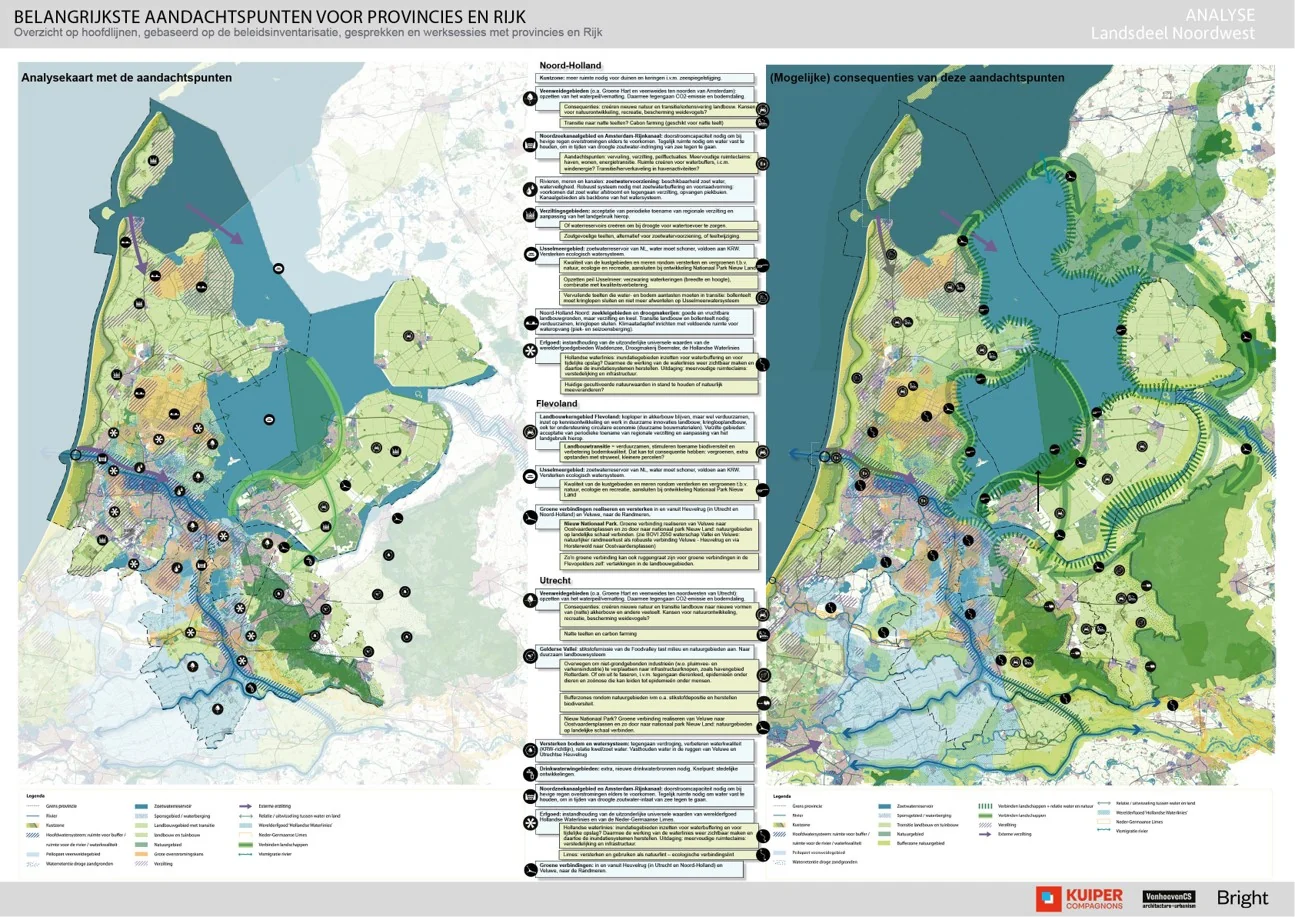
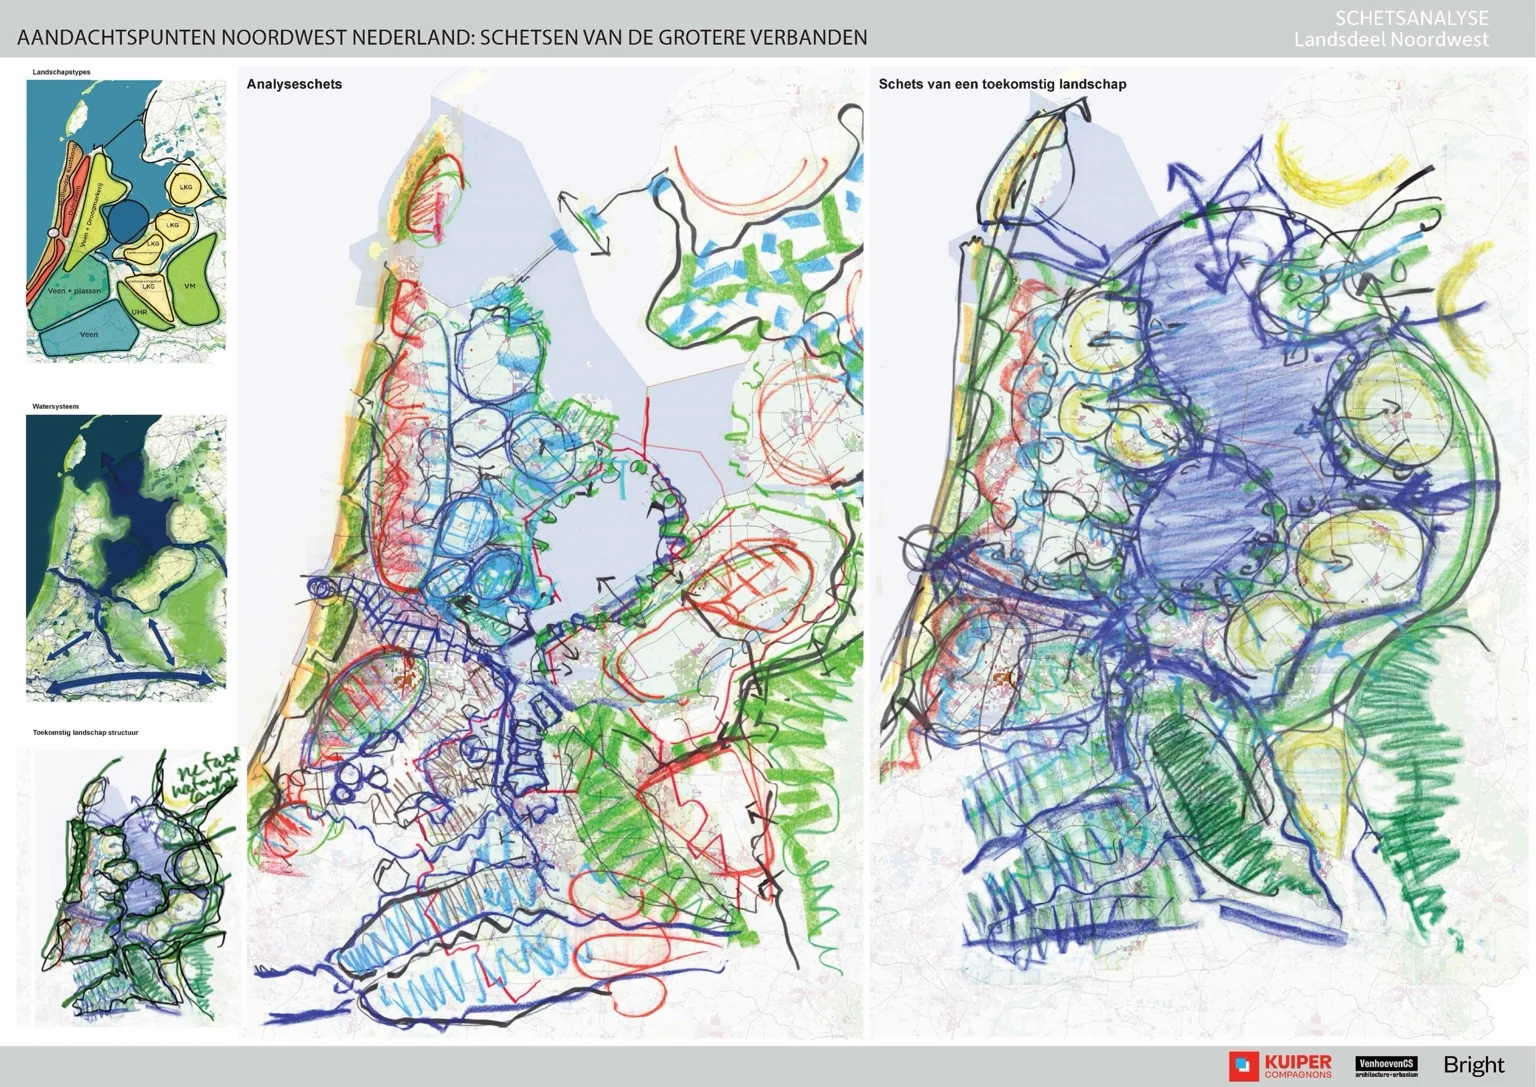
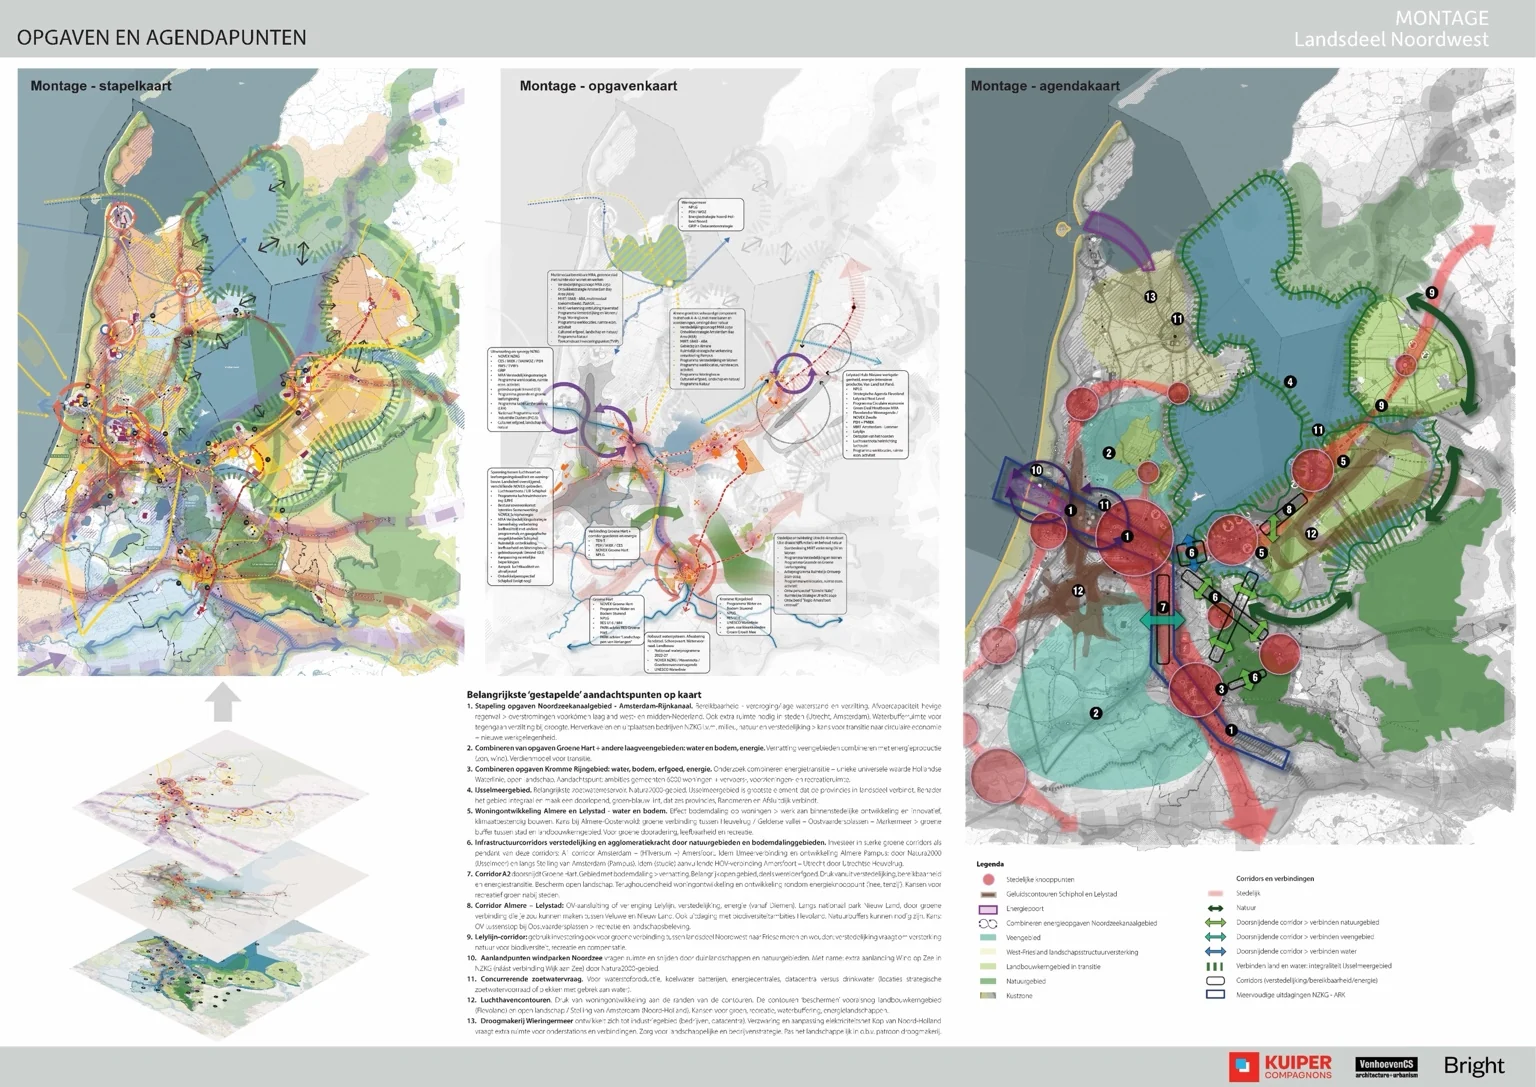
How can many sectoral demands be understood together, so the relationships between water, landscape, energy, housing and infrastructure become visible?
My contribution
I helped synthesise information into maps and develop the visual language of the study. Working with the team, I translated overlapping challenges into images that could support spatial interpretation and strategy.
The value
The maps make relationships, tensions and opportunities legible across provincial boundaries, creating a basis for a shared spatial conversation.